Profiling
nanos world includes built-in tools for profiling both the server and the game client in real-time. Using profiling tools is essential when optimizing large servers, identifying Lua bottlenecks, analyzing frame spikes, debugging networking issues, or improving overall performance.
Tracy Profiler
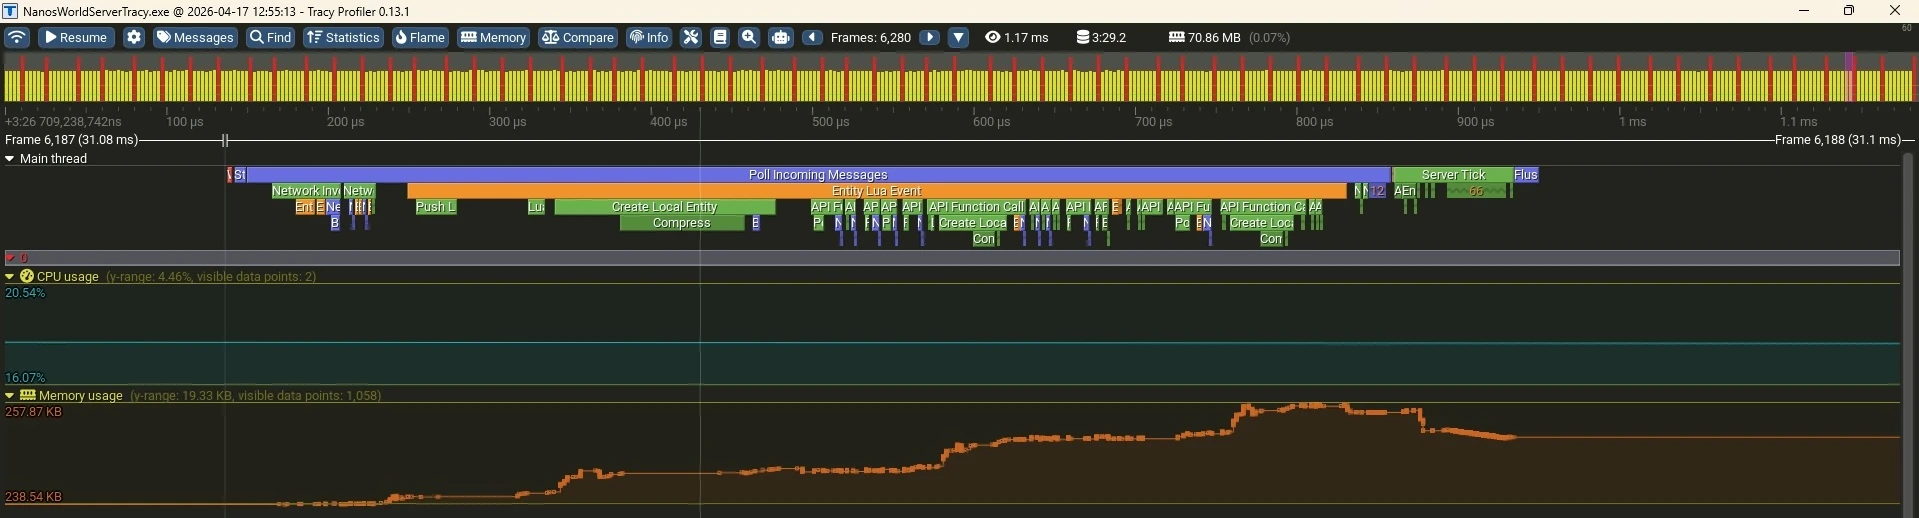
Tracy frame overview
nanos world server includes built-in integration with the Tracy Profiler, allowing you to profile the server in real-time.
Tracy is a real-time, nanosecond-resolution profiler widely used in game development and high-performance applications. It provides an interactive timeline view where you can inspect exactly what your application is doing during each frame.
Unlike traditional profilers, Tracy allows you to inspect performance live while the game or server is running. It provides a detailed timeline view of your application's execution, including:
- Lua calls
- Events callbacks
- Timer callbacks
- Internal systems
- Network processing
- Frame times
- Thread activity
- Memory allocations
- Lock contention
- Loading times
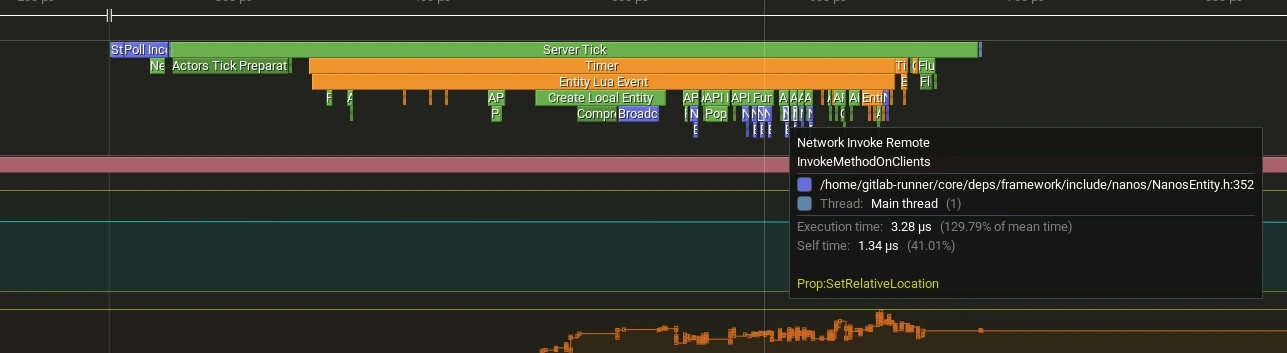
Tracy detailed view while hovering
Downloading Tracy
First, download the Tracy Profiler client application from the official releases page:
Download Tracy Profilerhttps://github.com/wolfpld/tracy/releasesAfter downloading, launch the Tracy application.
Launching the Server
To launch your server with Tracy profiling enabled, you must launch it like that:
- Windows
- Linux
./NanosWorldServerTracy.exe
./NanosWorldServer.sh --tracy
Connecting to the Server with Tracy
Once the server is running with profiling enabled:
- Open the Tracy Profiler application
- Either enter the server IP address or select it from the list of available connections
- Click Connect
Tracy will immediately begin capturing profiling data from the running server.
Native Profiling
We also integrated a native profiling command that can be used to capture profiling data without using Tracy. It works by outputting the execution time of some pre-defined parts of the code to the server or client console (or the client's Profiling UI).
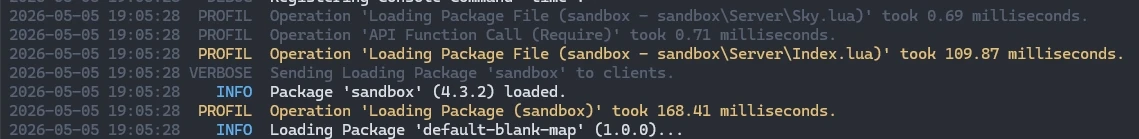
Server console outputting profiling information
Server Profiling
To enable server profiling, simply launch the server with the --profiling command or set profiling = true in the server's Config.toml file.
It will output PROFIL logs to the server console, showing the execution time of various systems and Lua callbacks.
Client Profiling
To enable client profiling, you must enable it in the Game Settings under the Debug tab:
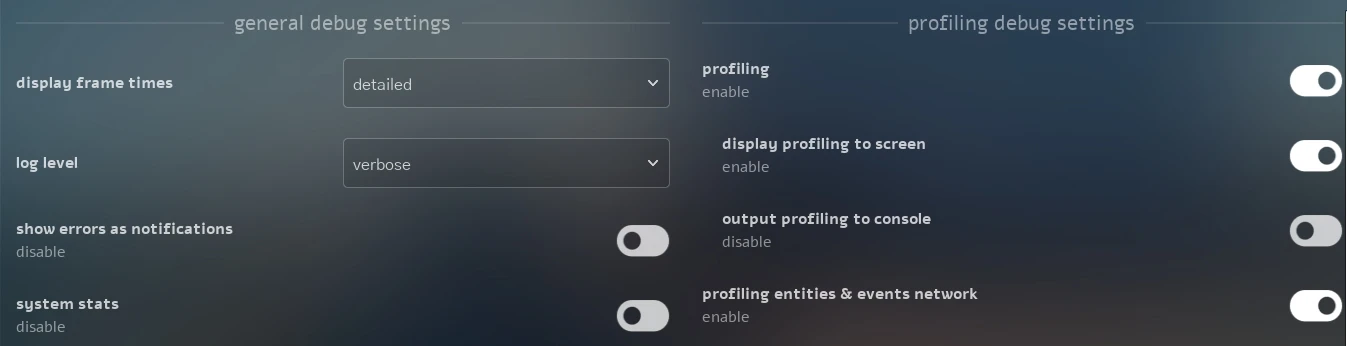
Game Settings - Debug Tab
display frame times
By enabling it, it will show a Debug UI with:
fps(frames per second - and the DLSS Frame Generation displayed fps under parenthesis)frametime(time taken to render each frame in milliseconds)fps 1% low(the average fps of the worst 1% frames)game(time the game thread spent)render(time the render thread spent)rhi(time the RHI thread spent)gpu(time the GPU spent)

Frametimes Debug UI
display profiling to screen
Enabling it, it will display the Profiling UI with all operations and their execution times directly on the game screen, allowing you to monitor performance in real-time without needing to check the console:
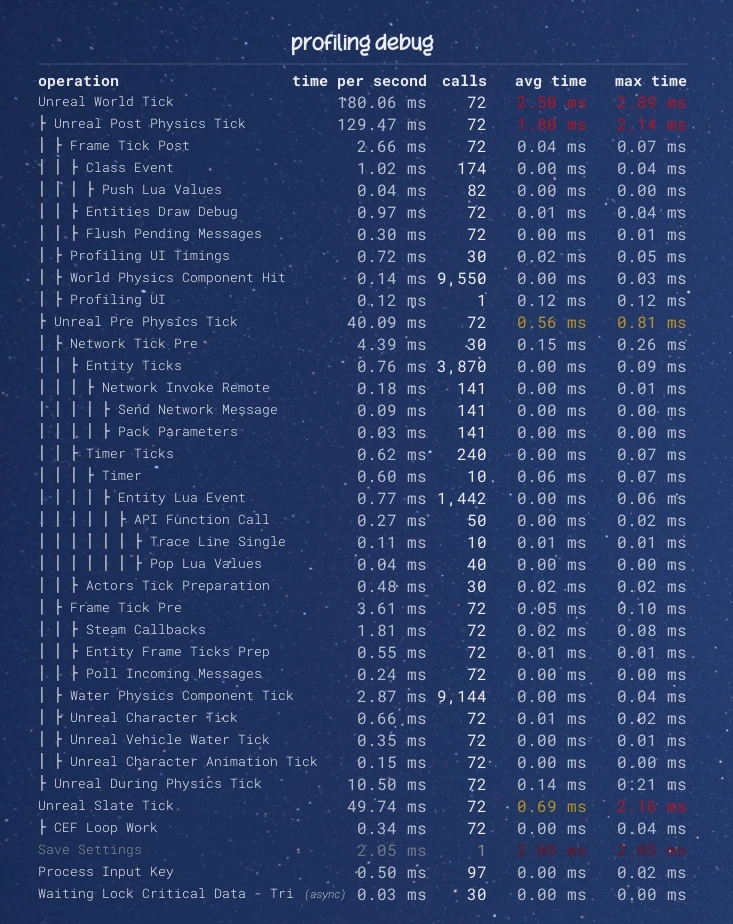
Profiling Debug UI
output profiling to console
Enabling it will output profiling information to the game console, exactly like the server side.
profiling entities & events network
Enabling it will display each entity network usage, along with scripting events and other syncing network usage on screen:
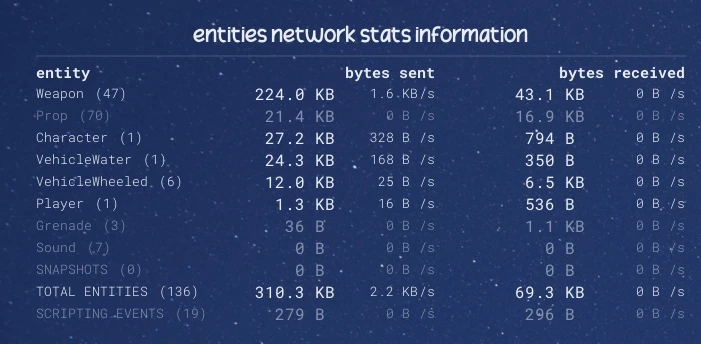
Entities Network Stats Debug UI